Most MLB teams have played a little more than 50 games, making the season about one-third complete. The standings in Roto leagues are settling down and teams aren’t riding the roller coaster quite so violently. Now is a great time to review and set a plan for the next few months.
Team examination may be humbling. It may be time-consuming. It may feel hopeless. We must put our teams through it in order to properly diagnose our needs and how to address them.
Identify Surprises
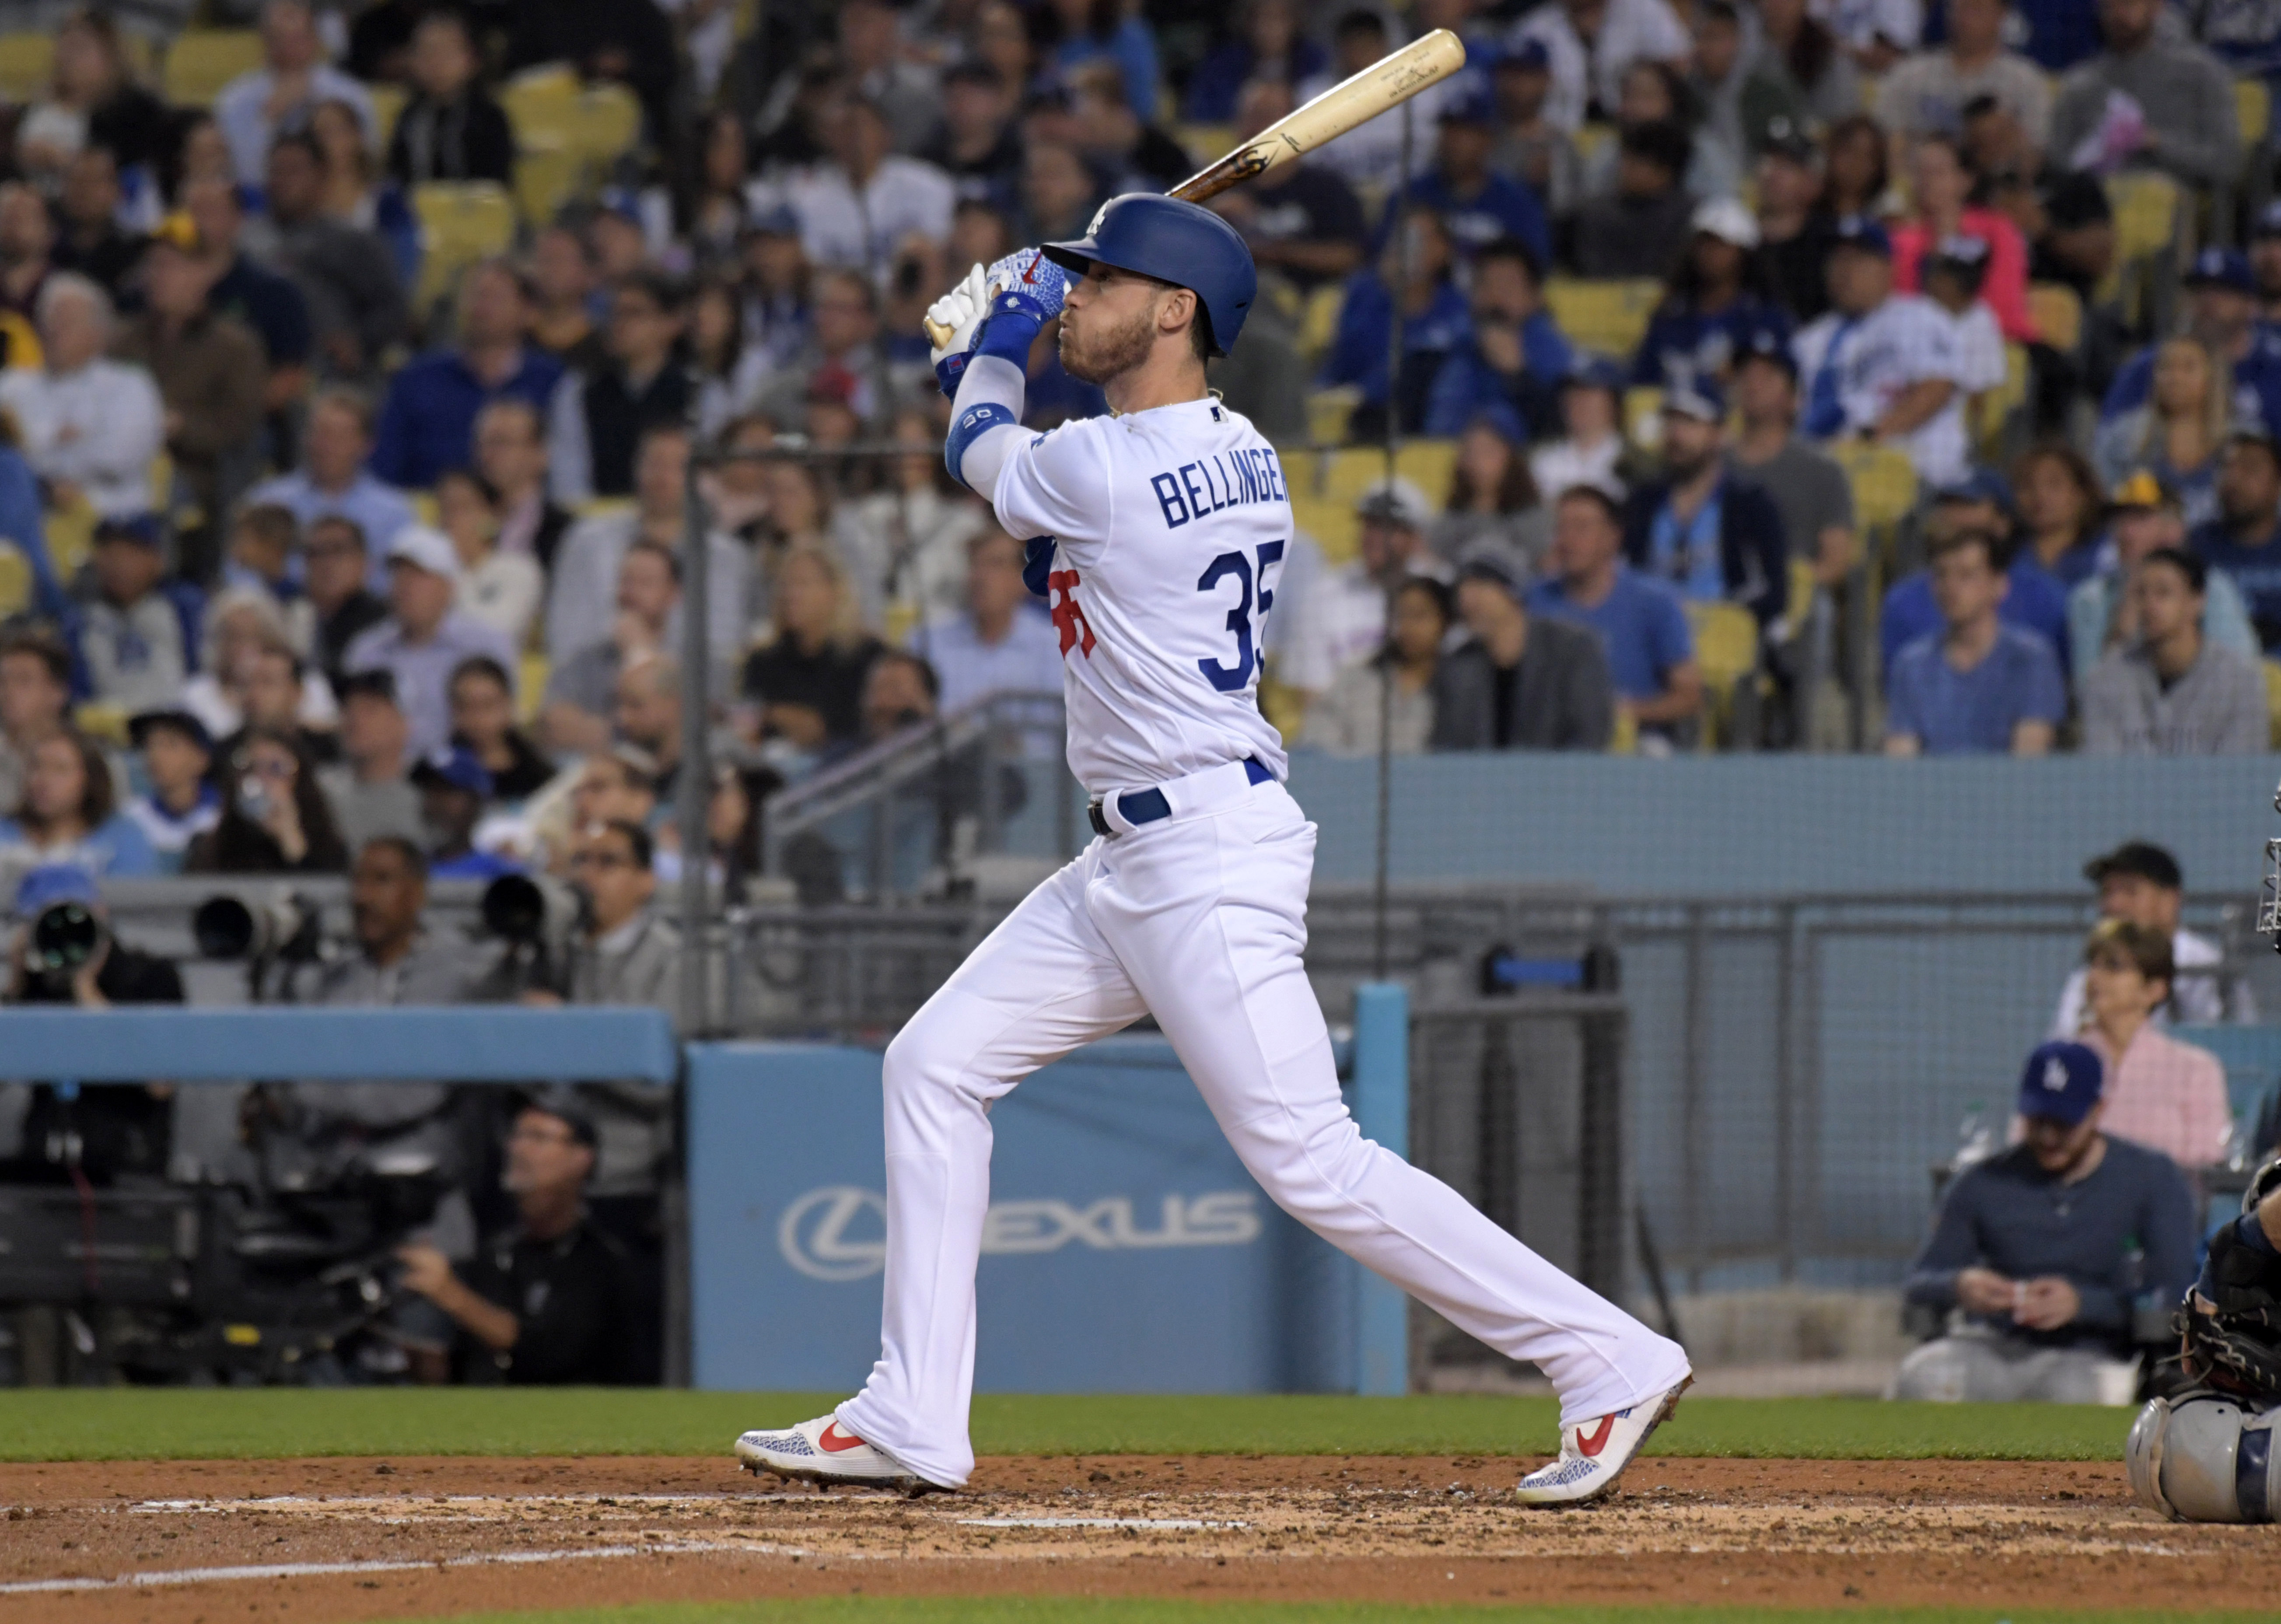
We need to be objective in team critique. I got lucky drafting Cody Bellinger in the fourth round. I took a flyer on Dwight Smith Jr. and picked him up early in the season as an injury replacement because he was the only everyday player in the free agent pool. Pure luck.
It is vital to honestly evaluate our teams. We must look at our players without bias, but it isn’t easy to do. Christian Yelich slid into the middle/end of the first round because it didn’t seem possible that he could maintain 2018’s 35% HR/FB. Unbelievably, Yelich has actually raised it to 38.9%. As good as Yelich is, we need to be honest in our evaluation and admit that this may be a surprise. We have his excellent banked stats, but we cannot honestly expect him to maintain these results. Understanding this will give us a better chance of realistically evaluating our teams and our results so far.
Acknowledging the Impact of Injuries
Injuries have hit every fantasy team to varying degrees. Early season long-term injuries to key pieces can be tough, but may not be devastating. Still, a player’s return can provide a boost. If you are behind in steals and Trea Turner has recently returned, you can easily see climbing in the SB category. When dealing with injuries, the goal is to have replacements who will allow your team to hang in until drafted (presumably better) players return. If your teams are struggling without key players, resist the temptation to panic, because the next third can see gains when players return and do as they are expected.
When it comes to injuries, the kind your players are suffering. Are they accidents or ongoing problems? Trea Turner’s broken hand is significantly different than A.J. Pollock’s elbow injury, for instance. If your team has many players who have reoccurring injuries of a similar nature, reflect on your draft. Are you drafting too many of these players and taking on unintentional risk? Did you draft players who entered the season on the IL? If so, your team may have been handcuffed from the beginning. Reflecting on the draft could help avoid the same mistakes next year.
Overall Standings
Once we have identified surprises, we need to examine our position in the standings. Are we at the top of the league because we hit on positive surprises? Are we struggling at the bottom of the league after players have underperformed or because we have been ravaged by injuries? Of course, it is obvious that we need to get to the top of the standings, but knowing how to do that and making a plan is vital. The best way is to assess individual standings.
Individual Standings
This can be a daunting and time-consuming aspect of team assessment. It is best examined through example. Here are the standings of one of my 12-team home leagues (my team is, the highlighted, Tigers):
| Rank | Team | R | HR | RBI | SB | AVG | W | SV | K | ERA | WHIP | Points |
| 1 | Rangers | 11 | 12 | 11 | 11 | 11 | 9 | 12 | 6 | 12 | 10 | 105 |
| 2 | Dodgers | 10 | 7 | 12 | 9 | 12 | 7.5 | 8 | 12 | 6 | 4 | 87.5 |
| 3 | Tigers | 7 | 6 | 8 | 12 | 5 | 12 | 2.5 | 11 | 9 | 11 | 83.5 |
| 4 | Giants | 12 | 8 | 10 | 4 | 6 | 11 | 2.5 | 9 | 7 | 5 | 74.5 |
| 5 | Rays | 8 | 10.5 | 9 | 10 | 8 | 2 | 6.5 | 5 | 3 | 8 | 70 |
| 6 | Brewers | 3 | 5 | 3 | 5.5 | 2 | 10 | 6.5 | 4 | 10 | 12 | 61 |
| 7 | Astros | 4 | 4 | 5 | 3 | 7 | 3 | 11 | 8 | 8 | 7 | 60 |
| 7 | Pirates | 6 | 2 | 2 | 7 | 3 | 4 | 9 | 7 | 11 | 9 | 60 |
| 9 | Mets | 2 | 10.5 | 4 | 5.5 | 1 | 7.5 | 4.5 | 10 | 4 | 6 | 55 |
| 10 | Orioles | 9 | 9 | 7 | 1 | 10 | 6 | 1 | 2 | 2 | 2 | 49 |
| 11 | Royals | 5 | 1 | 6 | 2 | 9 | 5 | 4.5 | 3 | 5 | 3 | 43.5 |
| 12 | Angels | 1 | 3 | 1 | 8 | 4 | 1 | 10 | 1 | 1 | 1 | 31 |
Looking at the points standings is fine. It shows me that I am doing very well in Stolen Bases, Wins, Stirkeouts, and WHIP and am struggling in Home Runs, Average, and Saves. This information doesn’t mean much; just how well or poorly am I doing? The total stats leaderboard is where attention must be paid:
| Team | R | Team | HR | Team | RBI | Team | SB | Team | AVG |
| Giants | 330 | Rangers | 101 | Dodgers | 307 | Tigers | 44 | Rangers | 0.273 |
| Rangers | 314 | Rays | 99 | Rangers | 297 | Rangers | 43 | Orioles | 0.273 |
| Dodgers | 306 | Mets | 99 | Giants | 296 | Rays | 39 | Rays | 0.265 |
| Orioles | 298 | Orioles | 97 | Rays | 295 | Dodgers | 34 | Astros | 0.265 |
| Rays | 297 | Giants | 92 | Tigers | 294 | Angels | 33 | Dodgers | 0.276 |
| Tigers | 289 | Dodgers | 88 | Orioles | 293 | Pirates | 30 | Royals | 0.267 |
| Pirates | 284 | Tigers | 84 | Royals | 292 | Mets | 29 | Giants | 0.262 |
| Royals | 278 | Brewers | 82 | Astros | 289 | Brewers | 29 | Tigers | 0.259 |
| Astros | 272 | Astros | 80 | Mets | 263 | Giants | 27 | Angels | 0.25 |
| Brewers | 271 | Angels | 79 | Brewers | 259 | Astros | 26 | Pirates | 0.249 |
| Mets | 263 | Pirates | 76 | Pirates | 248 | Royals | 22 | Brewers | 0.236 |
| Angels | 260 | Royals | 65 | Angels | 234 | Orioles | 20 | Mets | 0.232 |
My team is shaded and indicates my position in each hitting category relative to all the other teams. While it is nice to be atop the SB category, I only lead by 1. A bad few days and I could fall out of top spot. I need to continue to achieve in SB. A more interesting category, however, is RBI. I sit with 294 points in 5th place. Notice that if I had 4 more RBI, I would rise to 2nd place.
Looking at the other power categories, I am within striking distance in Runs and Home Runs. Since I also need RBI, I need to make a plan to get a a power bat. I may have to reconsider my earlier assessment that I need to keep pushing in the SB category. I really need to think about shifting my focus away from SB to the other hitting categories. Maintaining the one point in SB isn’t as helpful as gaining more than 4 points in the other categories. This will be my focus for the next third of the season.
Remember when evaluating your standings, that the gains that are needed in each category are just that: gains. Sure, it is easy to say that I could jump four points in the overall standings if I added 4 RBI, but it isn’t that simple. I have to maintain my current production of RBI, hope that my competitors will do the same (or decline), and I have to gain 4 RBI. Recalling the earlier discussion about surprises, what if I don’t get the unexpected performances that I may have enjoyed so far? Not only do I make gains, but I also have to maintain my current pace. Honest assessment of our teams and how we have achieved our banked results really helps analysis of the standings and where we need to go.
Don’t Ignore Ratios
Improving in the ratio may actually be an easy place to gain points. Why? Because you can usually find cheap players on the wire to help you in two of the three ratio categories: ERA and WHIP. If our goal is to find a pitcher who can bring down our ERA and WHIP, there is an easy place to look: relief pitchers. Our free agent pool won’t have big name starters or closers, but they usually have impact relievers. Look for shut-down pitchers who, ideally, pitch multiple innings (the more clean innings we get, the greater the impact to our ratios). Multiple innings are not as important as the quality of those innings, however. We are looking for low BB% high K% pitchers who will throw 4-7 clean innings per week. A simple search of RP ERA Leaderboards can spot players who may be available and look like great ratio helpers:
When looking at category standings, it is easiest to focus on counting stats and ignore the ratios. The thinking may be: “It’s too hard to catch people in the ratios.” Actually, it might be easier! Don’t forget that one of the main differences between the counting and ratio categories is that the competitors above us can fall. A counting stat is banked; it isn’t going anywhere. On the other hand, a ratio stat can rise AND fall. We don’t just need to improve in a category, a poor performance from our competitors can bring them closer to us.
Through May 26:
| Pitcher | IP | K/9 | BB/9 | ERA | WHIP | CBS Ownership |
| Ryan Pressly | 23.1 | 10.03 | 0.39 | 0.39 | 0.56 | 28% |
| Francisco Liriano | 23.1 | 11.57 | 3.86 | 0.77 | 1.03 | 2% |
| John Gant | 28.2 | 9.73 | 2.51 | 1.26 | 0.7 | 31% |
| Taylor Rogers | 20.2 | 11.76 | 2.18 | 1.31 | 1.31 | 21% |
| Liam Hendricks | 26.2 | 9.45 | 3.71 | 1.35 | 1.13 | 1% |
| Ty Buttrey | 26.1 | 10.94 | 1.71 | 1.37 | 1.06 | 26% |
| Amir Garrett | 21.2 | 13.71 | 4.15 | 1.66 | 1.11 | 9% |
Warning: These pitchers can sometimes hurt your ratios. When blown up in an appearance, these pitchers can cause quick damage to your ratios. Chad Green, AJ Minter, and Carl Edwards Jr. all would have done more harm than good. That harm can take many weeks to undo. Consider also that the increase in the hitting environment has impacted both starters and relievers. As of May 26, the league-wide ERA/WHIP for starters and relievers is 4.36/1.30 and 4.37/1.36 respectively.
The fantasy baseball race to the top of the standings is one-third complete. With sample sizes growing, and results taking shape, it is vital to examine our teams and set a plan for the next segment of the season. Adjustments are best made when done with an honest, unbiased, and realistic examination of our fantasy team and league. Once an evaluation has been made, a plan can be set in place and, with luck, it will yield positive results. We need to take time now to see our strengths and our weaknesses and look at how we can improve. When we reach the end of the next third, we can re-evaluate and create a new plan.
Mark McElroy can be reached on Twitter @MarkMcElroyBB.