
Tarik Skubal has been a popular name to discuss this winter for a number of reasons. One prominent line of conversation suggests that Skubal will not return draft cost because the Detroit Tigers are a bad team, and therefore Skubal will not generate enough wins to support his elevated pick (SP12 in Rotowire Online Championships). I would agree this hypothesis is generally true, but wanted to add a little more granularity to analysis around team quality and its effect on pitchers.
Before getting into the meat of the analysis, I wanted to start with a couple of my conclusions:
- Team wins are important. The difference between playing for a 90-win team and a 70-win team is worth about 3 wins over 30 starts.
- ERA is the most important factor of a starting pitcher’s winning percentage, not team wins.
- After controlling for ERA, the difference between playing for a 90-win team and a 70-win team is about 1.5 wins over 30 starts.
To start my analysis, I looked at all starting pitcher seasons of 100+ innings from 2014 to 2023 and calculated the correlation and r-squared between ERA and Wins.
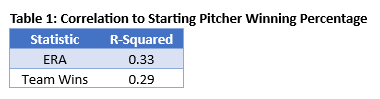
From here, I was able to create a formula that predicted an individual’s winning percentage given an ERA and number of team wins. The formula below shows a couple of things. First, one run of ERA is worth about 27 team wins (In other words, the difference between a 3.00 ERA pitcher and 4.00 ERA pitcher is the same as a playing for a 70-win team and a 97-win team). Second, it gives us a useful tool to evaluate pitcher win totals in the upcoming season.
SP Winning Percentage = ERA * -0.0737 + Team Wins * 0.0027 + 0.4281
I applied this analysis to starting pitchers drafted directly before and directly after Tarik Skubal in NFBC Online Championships. First, I averaged the projected ERA from the four major public projection systems (Zips, The Bat, ATC, and Steamer) and then captured the projected team wins on Fangraphs for all of these pitchers’ respective teams. Lastly, because we are really focused on winning percentage in this comparison, I standardized each pitcher to 30 GS.
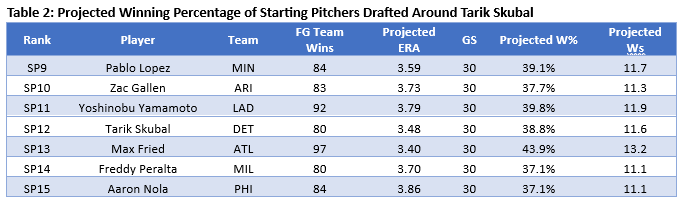
At least on a rate basis, there is not a “Wins” argument against Tarik Skubal. He projects for the fourth best winning percentage of this group, ahead of Zac Gallen, Freddy Peralta and Aaron Nola. Skubal also falls just behind Pablo Lopez and Yoshinobu Yamamoto. Max Fried is really the only outlier in this group with a massive 44% projected winning percentage (best ERA and best team will do that).
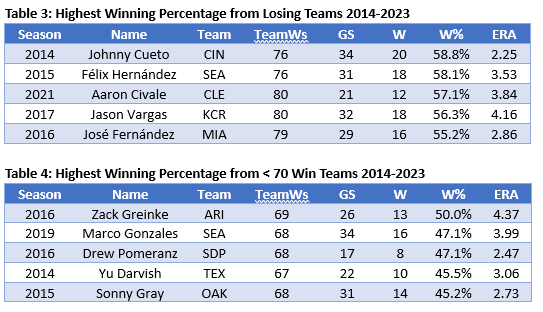
Just for fun at the end of this article, I wanted to compile the best “winning” seasons from pitchers on below .500 teams (Table 3) and pitchers from teams from less than 70 wins (Table 4).


Excellent use of correlation statistics. Pearson’s would be wonderful to see, or a few more decimal places on the r-squared. Great take parallel point with the 3.00 vs. 4.00 ERA.
Any difference in the model if forced through zero vs. not forced through zero? Does your model look slightly different if a non-parametric approach to wins is used (i.e. ranking wins totals, then analyzing correlation)?
Very well done. You have me thinking.