I’m Crosby Spencer with CREATiVESPORTS and I’ll be writing about Statcast data and what it has to offer for seasonal, dynasty and daily fantasy baseball. From deep player dives to park factors to expected stats based on Statcast data to converting Baseball Savant leaderboards into usable cheat-sheets, I’ll bring a unique and in-depth view of fantasy baseball.
On February 27 2010 Steve Slowinski wrote an article on Fangraphs titled “Park Factors”. Here’s an excerpt:
The Noble Goal
If you had the power to do so, you’d want to know how every single plate appearance would play out in all 30 MLB parks. If it turned into a single in the park of interest and then went for a single in 25 other parks, an out in three, and a double in one, you’d have a good sense of the way the parks played. The park that allowed the double would be a hitter’s park and the ones that created outs would be more pitcher friendly. But unfortunately, we don’t have that kind of data.
We want to know how parks influence each moment of the game, but we simply don’t have granular enough data to really get there. A ball hit at 15 degrees directly over the shortstop while traveling at 93 miles per hour will travel how far and land where? That’s basically what we want to know for every possible angle and velocity, but we just don’t have the data and we don’t have it for every type of weather in every park.
Instead, we have to settle for approximations.
Now, we do have that data.
The Importance of Handedness and Hit Location
We know a left-handed batter playing 81 games in Yankee Stadium is likely to hit more home runs than he would playing home games at Oracle Park in San Francisco. Additionally, it doesn’t take a savant to realize that a 370 ft. fly ball down the left field line will be a homerun 100% of the time while a 370 ft. fly ball to centerfield will never clear the fence. Handedness and hit location matter. However, the Statcast data on Baseball Savant reveals much more. The data available allows us to see details such as how hard a ball was hit (Exit Velocity), trajectory (Launch Angle), whether it was hit by a right-handed batter or a left-handed batter, the distance a ball was hit, and by using the X and Y coordinates, where the ball was hit. I took all this data and determined whether a ball was hit to left field, left-centerfield, center field, right-centerfield or right field. I further broke this information down to whether the ball was pulled, hit to the opposite field, pulled to the alley, hit to the opposite alley, or hit to center. This analysis netted some interesting results.
All Batted Ball Events with an Exit Velocity between 90-110 MPH and a Launch Angle of between 15 and 35 degrees in 2018 and 2019
| LA | PULLED | OPPOSITE | +/- | PULLED-ALLEY | OPPO-ALLEY | +/- | CENTER |
| 35 | 377.8 | 347.7 | 30.2 | 378.9 | 366.9 | 12.1 | 371.3 |
| 34 | 383.9 | 355.3 | 28.6 | 379.7 | 360.3 | 19.4 | 377.6 |
| 33 | 385.1 | 356 | 29.1 | 388.1 | 360.7 | 27.4 | 380.7 |
| 32 | 386 | 351.2 | 34.7 | 387.7 | 372.8 | 14.8 | 383.5 |
| 31 | 388.5 | 357.5 | 30.9 | 391.1 | 370 | 21.2 | 386.1 |
| 30 | 388.2 | 357.5 | 30.7 | 393.8 | 374.4 | 19.4 | 387.4 |
| 29 | 386.5 | 349.9 | 36.6 | 393.7 | 375.6 | 18.1 | 391.2 |
| 28 | 385.3 | 358.4 | 26.9 | 395.4 | 378.6 | 16.8 | 390.5 |
| 27 | 380.3 | 356.6 | 23.8 | 394.9 | 372.8 | 22.1 | 391.9 |
| 26 | 376.9 | 356 | 20.9 | 391.2 | 376.3 | 14.9 | 391.6 |
| 25 | 373.6 | 354.1 | 19.5 | 389.5 | 371.8 | 17.7 | 389.9 |
| 24 | 363.5 | 344.7 | 18.8 | 384.6 | 372.9 | 11.8 | 386.3 |
| 23 | 356.3 | 349.8 | 6.5 | 378.6 | 367.7 | 10.8 | 381.8 |
| 22 | 346.8 | 337.7 | 9.1 | 369.1 | 363.2 | 5.9 | 375.8 |
| 21 | 335.4 | 331.8 | 3.6 | 361.4 | 355.9 | 5.5 | 368.4 |
| 20 | 326.1 | 327.5 | -1.4 | 349.2 | 350.5 | -1.4 | 359.4 |
| 19 | 313.7 | 323.4 | -9.7 | 340 | 342 | -2 | 349.2 |
| 18 | 298.6 | 309.7 | -11.1 | 329.4 | 328.8 | 0.6 | 337.1 |
| 17 | 282.6 | 302.2 | -19.6 | 313.3 | 321.6 | -8.3 | 326.1 |
| 16 | 269.5 | 295.1 | -25.6 | 294.7 | 305.9 | -11.2 | 311.7 |
| 15 | 254.3 | 278.3 | -24 | 281.7 | 297.5 | -15.9 | 295.5 |
A pulled ball at a Launch Angle (LA) between 24 and 35 degrees and an Exit Velocity (EV) between 90 and 110 MPH will fly 18.8 ft. to 36.6 ft. further than a ball with the same LA and EV hit to the opposite field. This is are akin to the difference between hitting at Coors Field and hitting at sea level. In short, whether a ball is pulled, centered or hit the opposite way matters tremendously, yet is missing from all analysis that I’ve come across to date (apologies to any work that I haven’t seen). To read more about the forces that impact the flight of a batted ball I suggest checking out this site here.
Park Factors Primer
Let’s remember what Slowinski wrote, “If you had the power to do so, you’d want to know how every single plate appearance would play out in all 30 MLB parks.” Now that we do have that power, I set out to find the results of all Batted Ball Events (BBE) from 2017 – 2019 by LA, EV, handedness, hit location and whether the ball was pulled, hit to the opposite field, pulled to an alley, hit to the opposite alley or centered. Taking all these factors into account we come up with a baseline for how all of the BBEs played out in all 30 MLB stadiums. Here is a sample, displaying all BBEs in 2019 at an EV of 96 MPH and a LA of 26 degrees in 2019.
| EV | LA | BBE | H | AVG | 1B | 2B | 3B | HR | 1B% | 2B% | 3B% | HR% | |
| ALL | 98 | 26 | 85 | 42 | 0.494 | 0 | 17 | 6 | 19 | 0% | 20% | 7% | 22% |
| PULLED | 98 | 26 | 13 | 11 | 0.846 | 0 | 1 | 1 | 9 | 0% | 8% | 8% | 69% |
| OPPO | 98 | 26 | 19 | 11 | 0.579 | 0 | 6 | 0 | 5 | 0% | 32% | 0% | 26% |
| CENTER | 98 | 26 | 30 | 3 | 0.1 | 0 | 2 | 1 | 0 | 0% | 7% | 3% | 0% |
This data demonstrates why it’s so important to use more than just EV and LA. Using only those two factors yields an expected AVG of .494 and an expected HR rate of 22.4% for every ball hit at an EV of 98 MPH and a LA of 26 degrees. However, if hit to center field, it’s an out 90% of the time with a 0% chance of leaving the yard. Conversely, when pulled, that same EV and LA has an 85% of being a hit with a 69% chance of being a home run.
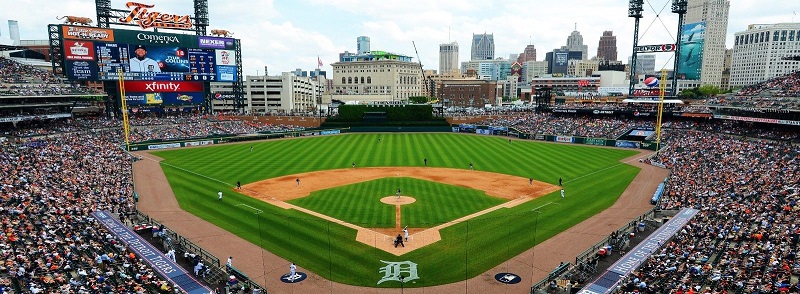
All the outcomes for the season can be assembled, generating the expected stats for each BBE. This data renders the mythical average MLB stadium in order to compare actual outcomes to expected outcomes. If the actual outcomes equal the expected outcomes, the Park Factor is 100. So, for example, if a ballpark yields 58 home runs to right field and the expected home run total in the average MLB ball park’s right field is 58 then their right field Park Factor is 100. If a ballpark yields 58 home runs and the expected home run total in the average MLB ballpark is 50 then their right field Park Factor is 116. Below is a sample of how these factors look for right-handed batter’s 806 BBEs to center field at Detroit’s Comerica Park for 2019.
| Park | H | 1B | 2B | 3B | HR | AVG | SLG | 1B% | 2B% | 3B% | HR% |
| Comerica | 296 | 236 | 33 | 13 | 14 | 0.367 | 0.493 | 0.293 | 0.041 | 0.016 | 0.017 |
| Neutral | 310 | 215 | 42 | 7 | 45 | 0.385 | 0.623 | 0.267 | 0.053 | 0.009 | 0.056 |
| Park Factor | 95 | 110 | 79 | 186 | 31 |
The factors for the other components (Pull, Pull Alley, Oppo Alley and Oppo) are determined in a similar manner. These are then combined to determined the individual factors for right-handed batters, left-handed batters and an overall index. The method will be detailed next time along with presenting hitting Noble Park Factors for all 30 MLB venues.
Crosby Spencer played baseball for Fullerton College and is now a CFO. He combines his love for the game and statistical acumen writing about Statcast data for CREATiVESPORTS. Follow Crosby on Twitter.