Previously, I described my methodology, incorporating Statcast data to derive my own version of expected stats. Here are some additional players I’m buying based on the results.
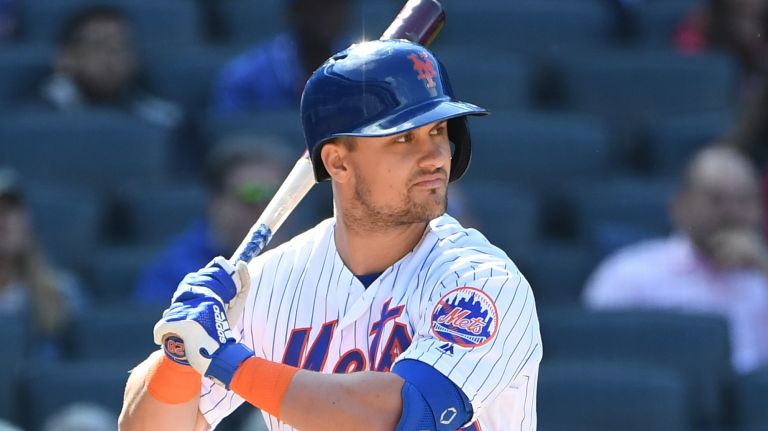
J.D. Davis, New York Mets, 3B,OF
| aSGP | CT | BB | AB | H | HR | SB | R | RBI | BAV | WOBA | |
| Actual | -2.45 | 76.0% | 8.5% | 410 | 157 | 22 | 3 | 65 | 57 | 0.307 | 0.383 |
| Expected | -1.15 | 76.0% | 8.5% | 410 | 163 | 24 | 3 | 67 | 71 | 0.315 | 0.397 |
| Actual 650 PA | 2.13 | 76.0% | 8.5% | 595 | 228 | 32 | 4 | 94 | 83 | 0.307 | 0.383 |
| Expected 650 PA | 4.02 | 76.0% | 8.5% | 595 | 236 | 35 | 4 | 98 | 103 | 0.315 | 0.397 |
aSGP Values based on a 10 team, 5×5, 14 hitters league
Davis started the 2019 campaign as a reserve outfielder, backup third basemen and pinch-hitting bench option for the Mets. Due to injuries, Davis was thrust into the starting lineup for much of April, and then from about the middle of July on. The 26 year old, former third round pick out of Cal State Fullerton took full advantage. He had just average plate discipline skills but excelled everywhere else. In just 448 plate appearances, Davis. ranked as the 108th most valuable batter. Prorated to a full season, this paces out to the 37th best hitter and the 55th best player overall.
The 6-foot-3, 218 pounder’s expected Statcast numbers not only supported his breakout, they say he was a little unlucky in the RBI department. Despite getting 88% of his plate appearances in the second through sixth spot in the lineup, and the Mets ranking as just above average in runs scored, Davis tallied 20 fewer RBI than expected over a full season. With the prospects of a universal DH and Davis having no matchup issues (.886 OPS vs RHP, .913 vs. LHP), consistent playing time should not be an issue.
Davis is currently going 165th overall but has a top 26 to 55 overall upside. By merely investing a one round premium on last year’s ranking the smart owner could be netting 9 to 15 round profit and gaining six points in the standings, depending on the format.
Verdict: Trust the full season expected line from Davis.
Franmil Reyes, Cleveland Indians, OF
| aSGP | CT | BB | AB | H | HR | SB | R | RBI | BAV | WOBA | |
| Actual | -1.68 | 68.0% | 8.7% | 494 | 174 | 37 | 0 | 69 | 81 | 0.249 | 0.353 |
| Expected | -0.27 | 68.0% | 8.7% | 494 | 183 | 24 | 3 | 67 | 71 | 0.267 | 0.371 |
| Actual 650 PA | 0.55 | 68.0% | 8.7% | 594 | 210 | 32 | 4 | 94 | 83 | 0.249 | 0.353 |
| Expected 650 PA | 2.24 | 68.0% | 8.7% | 594 | 220 | 35 | 4 | 98 | 103 | 0.267 | 0.371 |
Reyes was part of a crowded Padre outfield, resulting in less than full-time gig until his move to the Indians around the trade deadline. From that point, Reyes was a regular in Cleveland’s revamped outfield and consistently batted in the three through five hole. Like Davis, Reyes’ expected stats not only backed up his production, they actually indicate that more is possible in the areas of batting average and run production.
The 23 year old power hitting outfielder only had a .234 average on ground balls (average was .267 in ’19) and his sprint speed is not a negative, indicating that his expected batting average is more indicative of his skills than his actual .249 BAV.
As for run production, over a full season Reyes was expected to have 21 more runs + RBI than he actually paced. This is easily explained by Cleveland averaging 13% more runs than San Diego did last year and the Indians’ lineup looks even more potent in 2020. Some slight caution – the AL Central is not a great HR division for righty swingers when compared to the NL West. However, further maturation could easily render that moot.
Reyes is currently going 129th overall, about a round higher than where he ranked last year. This young man has top 50 potential even without growth which would produce a 5 to 8 round profit and 5.6 points gained in the standings.
Verdict: Trust Reyes’ full season expected line.
Jorge Soler, Kansas City Royals, OF
| aSGP | CT | BB | AB | H | HR | SB | R | RBI | BAV | WOBA | |
| Actual | 3.66 | 70.0% | 11.0% | 589 | 228 | 48 | 3 | 95 | 117 | 0.265 | 0.387 |
| Expected | 5.76 | 70.0% | 11.0% | 589 | 240 | 24 | 3 | 67 | 71 | 0.281 | 0.407 |
| Actual 650 PA | 3.66 | 70.0% | 11.0% | 589 | 228 | 32 | 4 | 94 | 83 | 0.265 | 0.387 |
| Expected 650 PA | 5.76 | 70.0% | 11.0% | 589 | 240 | 35 | 4 | 98 | 103 | 0.281 | 0.407 |
Soler finally lived up to his early career hype in 2019, and then some. Like the previous two players we’ve analyzed, Soler’s expected stats not only verify his actual stats but reveal that there may be more in the offing. However, unlike the previous two, we need to pump the brakes slightly. Given Soler’s park (90 RHB HR factor), his division’s parks (94), and his team context (12% below league average in runs), his actual stat line looks about right for 2019.
That being said, 2019’s numbers are good enough (though he’s missed an average of about a month due to injury over the last three years), which would have still made him worth more than his current ADP of 85. With top 30 potential we’re looking at a 4 to 6 round profit and 3.54 points gained in the standings.
Verdict: Mostly trust Jorge Soler’s 2019 actual stat line.
Danny Santana, Texas Rangers, 1B, OF
| aSGP | CT | BB | AB | H | HR | SB | R | RBI | BAV | WOBA | |
| Actual | 1.53 | 68.0% | 5.0% | 474 | 172 | 28 | 21 | 81 | 81 | 0.283 | 0.362 |
| Expected | 0.23 | 68.0% | 5.0% | 474 | 163 | 24 | 3 | 67 | 71 | 0.27 | 0.344 |
| Actual 650 PA | 5.83 | 68.0% | 5.0% | 617 | 223 | 32 | 4 | 94 | 83 | 0.283 | 0.362 |
| Expected 650 PA | 4.15 | 68.0% | 5.0% | 617 | 212 | 35 | 4 | 98 | 103 | 0.27 | 0.344 |
Santana exploded on the scene after bouncing between four teams in the last three seasons. The 28 year old journeyman had a full season pace of .283, 106, 36, 106, 27. Those are first round numbers. That said, there’s some obvious reasons for skepticism.
First of all, he’s never posted power and run production numbers like these. Second, his plate discipline skills are atrocious with a contact rate of 68% (league average 77%) and a walk rate of 5% (league average 8%). Lastly, his expected stat line suggest his numbers were a little fortunate. But, how fortunate?
Over a full season the expected stats show that he was pacing to pick up almost 20 runs + RBI and 13 points in batting average. However, a little deeper look shows us that Santana only had a .258 average on ground balls. Combining his sprint speed numbers with better batted ball luck on ground balls puts his average at .277. In the run production department, Texas is a solid run scoring team (103 factor) so those expected run + RBI losses of 18 turn into about 10. There is no doubt that Santana is a riskier pick, but with top 25 upside this player could return a 7 to 11 round profit and 5.73 points gained in the standings.
Verdict: Mostly trust the 2019 expected stat line (499 PA’s), which would still present a 3 to 5 round and 1.82 aSGP profit.