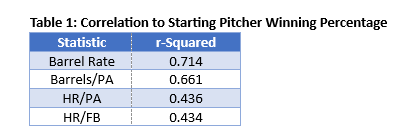
As Statcast analysis has become ubiquitous among fantasy baseball analysts, it becomes more important than ever to know what stats are, why they matter, and how they are being used. To me, barrel rate is a powerful, but often misapplied statistic when analyzing players. Barrel rate has become popular as a strong predictor of home runs (~55% of barrels are home runs). Plus, it has more predictive capability year over year than traditional home run metrics. But barrel rate divides total barrels by batted ball events. Fantasy baseball cares about raw home run totals (and therefore raw barrels). Barrel rate will tend to overstate the power potential of high strikeout, high walk rate hitters. While slightly less predictive, to me barrels per plate appearance is a much more useful statistic, particularly when projecting HR output for individual players.
I’ve cherrypicked some player comparisons from 2023 below to illustrate the flaws of a barrel rate only comparison.
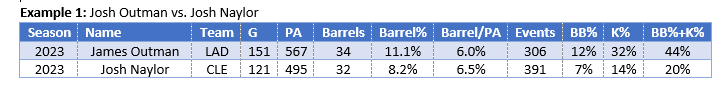
Better barrel-er of the ball last year, Josh Naylor or James Outman? Naylor had a below average barrel rate while James Outman ranked in the 72nd percentile. Despite this, because of Naylor’s superior contact and aggressiveness he had better barrel/plate appearance numbers.
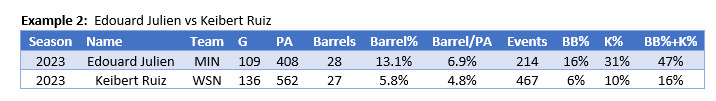
Who had more barrels last year – Edouard Julien and his 86th percentile barrel rate or Keibert Ruiz and his 25th percentile barrel rate? Julien had just one more barrel, 28 to 27. Between much lower K% and BB% in addition to increased playing time, Ruiz more than doubled Julien’s batted ball events.
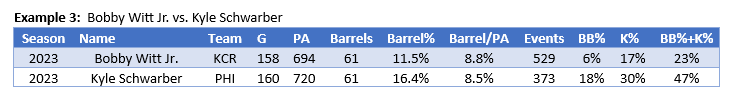
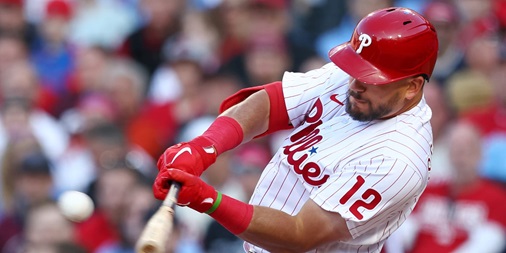
Our last comparison comes between a couple of elite offensive talents in Bobby Witt Jr. and Kyle Schwarber. Schwarber is something of a barrel god with a 96th percentile barrel rate (or better) in each of the last three years. Schwarber runs massive strikeout and walk rates, which limits his ability to put the ball in player. In fact, despite few plate appearances in 2023, Bobby Witt generated the same number of barrels as Schwarber despite a good (11.5%, 76th percentile) due to a much larger number of batted ball events.
One final note of caution – hard-hit rate suffers from the same flaws as barrel rate, namely the denominator is batted ball events rather than plate appearances. Like the comparisons above, a player with a lower hard-hit rate, but more batted ball events can actually have more total hard hits than their more passive counterparts.