If you’ve read my bio at Creative Sports, you know that I fell in love with baseball after moving to St. Louis in the mid-1960s. An only child with few friends, some of my best childhood memories were listening to Cardinals baseball games on KMOX Radio with Harry Caray and Jack Buck. After the firing of Caray in 1969, it was Jack Buck and later Mike Shannon.
I learned a lot about baseball from those broadcasts, including the statistics that were important back then. Most of those stats were on the back of baseball cards that I collected and traded religiously. My father taught me how to calculate a hitter’s batting average when I was in the fourth grade. I updated the averages of Lou Brock, Curt Flood, Ken Boyer and Bill White daily.
Back in those days, I believed that the best hitter in baseball was the one with the highest batting average. The best pitcher in baseball was the hurler with the lowest ERA. It was as simple as that. When I started playing fantasy baseball several years ago, I had a growing awareness that my approach to statistical analysis was antiquated and fell far short of what was necessary.
When I started writing about fantasy baseball for CreativeSports, I wanted to write from the perspective of a manager, sharing analysis, commentary, and strategies. Since my father was a college professor and my mother a high school teacher, it was natural for me to love teaching others about what I love. If you’re still learning about fantasy baseball, I hope to help you.
When I started playing fantasy baseball, I played in only public leagues because I wasn’t invited to play anywhere else. Frankly, I didn’t know anyone else that played fantasy baseball. One of my friends who played in my home league told me that he didn’t have time to play in a season-long league. He said it would be like having a full-time job, and that wasn’t far from the truth.
However, playing in public leagues gave me false confidence because my lack of knowledge didn’t keep me from winning, or finishing second, every time. As it turned out, most of the other managers weren’t very good. A lot of them quit before the season was over. However, reading articles and listening to podcasts opened my eyes to the brave new world of sabermetrics.
A few years before I “turned pro” and joined CreativeSports, my son gave me a book for Christmas. The book is entitled Smart Baseball, and it was written by ESPN veteran writer and statistical analyst Keith Law, now a senior baseball writer for The Athletic. The subtitle of the book is “The story behind the old stats that are ruining the game, the new ones that are running it, and the right way to think about baseball.” The last part was the most interesting to me.
Law’s chapter on the advent of the MLB Statcast era was eye-opening information. Law explains that the new data stream that teams changed the game forever. The data received from MLB Advanced Media (MLBAM) via Statcast includes 1.5 billion rows of data, each of which has about 70 fields, for all MLB games played. That’s about 100 billion items just in a single season.
If I told you I was now an expert on sabermetrics, it would be a bold-faced lie. Frankly, I feel like I’ve only scratched off the tip of the iceberg. The reason why baseball (and fantasy baseball) is so fascinating is that there’s so much to learn. You can spend hundreds of hours reading about stats and trying to apply them to your teams and still feel like you’re a complete ignoramus.
The purpose of this column today is to share some basic stats with you. Understanding these stats and how to apply them will make you a better fantasy manager. I’m talking about stats like BABIP, BB/K, BB/9, GB/FB, HR9, K/BB, K/9 (not a dog). Others, like wRC+, OPS+, FIP and SIERA will be left for another day. Here are 10 statistics that will help you be a better manager.
BATTING AVERAGE ON BALLS IN PLAY (BABIP)
Calculation:
BABIP = (H – HR)/(AB – K – HR + SF)
BABIP measures how often a ball in play goes for a hit. A ball is “in play” when the plate appearance ends in something other than a strikeout, walk, hit batter, catcher’s interference, sacrifice bunt, or home run. In other words, the batter put the ball in play, and it didn’t clear the outfield fence. The league BABIP in today’s landscape is ~.295.
There are several variables that can affect BABIP rates for individual players, such as defense, luck, and talent level. BABIP is one of the simplest and most important sabermetric statistics, but it is also one of the most misunderstood.
Hitters tend to establish their own baseline. If they are far over or under their career rate, then they are due for a correction (regression) unless they’ve changed something. Hitting the ball hard boosts BABIP, as do line drives. Ground balls result in hits more than fly balls in play, so a hitter’s batted ball profile helps shape his BABIP.
Pitchers tend to nestle around the league average. However, ground ball pitchers tend to carry a higher BABIP than fly ball hurlers.
STRIKEOUT RATE AND WALK RATE (Hitters)
Calculation:
K% = K / PA
BB% = BB / PA
Strikeout rate (K%) and walk rate (BB%) measure how often a hitter walks or strikes out on a per plate appearance basis. High walk rates are good for batters because it means they’re reaching base often. Hitters close to 1-to-1 are ideal, and you should avoid hitters with worse than 1-to-2 ratios. Consider in light of the overall set of skills.
STRIKEOUT RATE AND WALK RATE (Pitchers)
Calculation:
K% = Strikeouts / Batters Faced
BB% = Walks / Batters Faced
K/9 = Strikeouts x 9 / Innings Pitched
BB/9 = Walks x 9 / Innings Pitched
While K/9 and BB/9 are more mainstream and relatable, K% and BB% are a truer measure of a pitcher’s skills. For example, if a pitcher fans one and walks one while recording two more outs in an inning, his K/9 is 1.0, while his K% is 25%. However, if he got the side in order with one whiff, his K/9 is still 1.0, but his K% is now 33%. This is an extreme example but should illustrate why K% and BB% are superior for projection and ranking purposes.
In 2022, the league average K/9 was 8.53, while the league average K% was 22.4%. K% over 30% are elite.
The league average BB/9 was 3.10, while the league average BB% was 8.2%. BB% under 5% are elite.
Many feel the single most useful pitching stat is K%-BB%. The league average was 14.3%. Pitchers over 20% are best for fantasy.
STRIKEOUT TO WALK RATIO
Calculation
K/BB
Before K%-BB% came into vogue, strikeout to walk ratio was a popular filter to identify the more highly skilled pitchers. Pitchers above 2.5 are best for fantasy
CONTACT RATE (CT)
Calculation
(At Bats – Strikeouts)/At Bats
Hitters who put balls in play at 90% or above are ideal, but those who put the ball in play less than 75 percent will probably wind up with poor batting averages.
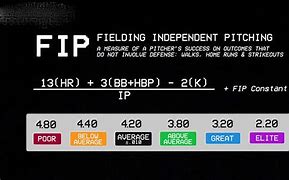
FIELDING INDEPENDENT PITCHING (FIP)
Calculation
((Home Runs x 13) + ((Walks + Hit By Pitch) x 3) – (Strikeouts x 2))/(Innings Pitched + 3.2*)
*Factor used to normalize FIP to the league average ERA
FIP is a defense neutral ERA. In general, a pitcher with a FIP higher than his ERA is getting lucky with his balls that are put in play. This means you can expect regression. The exception is if the defense behind the pitcher is above average, which could cause more batted balls to be converted into outs (example: New York Yankees, Los Angeles Dodgers, Cleveland Guardians).
GROUND BALL TO FLY BALL RATIO (GB/FB)
Calculation
Ground Balls/Fly Balls
A strong ground ball pitcher can overcome a low strikeout rate, while a fly ball pitcher will often need a deep ballpark to be successful unless he is adept at avoiding hard contact. A GB/FB > 50% is extreme, while GB/FB < 30% is considered a fly ball pitcher.
HOME RUNS ALLOWED PER 9 INNINGS (HR/9)
Calculation:
(9 x Home Runs Allowed/Innings Pitched)
The league average is usually a little above one home run allowed per nine innings, so you should avoid pitchers who are consistently ending up well above that number.
LEFT ON BASE (LOB%)
LOB% is the percentage of batters that reach base but do not score. Pitchers tend to hover near the league average, which is around 72%. Better pitchers can approach 78%. Reliever LOB% are unreliable since there is too much noise in a small number of innings. Watch for deviations from a pitcher’s career strand rate. For example, a pitcher who has a career strand rate of 71% but has an 85% strand rate in a particular season is getting lucky and will likely experience regression.
Many conflate LOB% and strand rate. They are essentially the same thing, but strand rate was a proprietary metric developed by BaseballHQ. Strand rate proved so useful that it has become mainstream. The league averages are virtually the same as LOB%.
Calculation:
LOB% = (Hits + Walks Allowed + Hit by Pitch – Runs)/(Hits + Walks Allowed +Hit by Pitch – 1.4 xHome Runs)
Strand Rate = (Hits + Walks Allowed – Earned Runs)/(Hits + Walks Allowed – Home Runs)
There are many more statistics that can be discussed, and I will touch on these are a later date. But for now, as you do your draft preparation work for the upcoming season, apply some of these statistics to help you distinguish between pitchers and hitters who are similar in many ways. Subtle differences can be identified by digging deeper with some of these advanced statistics.
Thomas L. Seltzer, AKA Doubting Thomas, writes about football and baseball for CreativeSports. Be sure to follow Thomas on Twitter@ThomasLSeltzer1.