Fantasy baseball pundits often recommend punting or ignoring batting average due to the year-over-year volatility of the statistic. This simple commentary ignores, or misses the effect stacking multiple bad batting averages on top of one another. Said differently, if you take multiple players with bad batting averages, your team will probably have a bad batting average. Let’s examine a few scenarios.
Table 1: NFBC Main Event Batting Average Percentiles
| Percentile | Batting Average |
| 99% | 0.272 |
| 90% | 0.265 |
| 80% | 0.262 |
| 70% | 0.260 |
| 60% | 0.258 |
| 50% | 0.257 |
| 40% | 0.255 |
| 30% | 0.253 |
| 20% | 0.251 |
| 10% | 0.248 |
| 1% | 0.240 |
Scenario 1.
- You select 14 players.
- They are each projected to hit .250 next season (just shy of the NFBC main event 20th percentile batting average).
- They have an even 50% probability to bat .275 or .225.
Given this scenario, what is the probability your team reaches an 80th percentile outcome in the main event? We can calculate the number of outcomes of any combination below using a traditional combinatorics formula: n C k = n! / [k! (n-k)!]. For example, the number of outcomes where there are seven 225 hitters can be calculated as 14! / 7! * 7!. This yields 3432 potential combinations of seven 225 hitters given 14 chances. Total outcomes can either be calculated by summing “Column 3 – Outcomes”, or by 2^14. Either way, Table 2 below shows us that in the above scenario, we have just a 2.9% chance of hitting an 80th percentile batting average target. Furthermore, there is an 82% chance we finish within seven points of our projected batting average.
Table 2: Probability of Team Average in Scenario 1
| 225 Hitters | 275 Hitters | Outcomes | Team Average | Individual | Cumulative |
| 0 | 14 | 1 | 0.275 | 0.0% | 0.0% |
| 1 | 13 | 14 | 0.271 | 0.1% | 0.1% |
| 2 | 12 | 91 | 0.268 | 0.6% | 0.6% |
| 3 | 11 | 364 | 0.264 | 2.2% | 2.9% |
| 4 | 10 | 1001 | 0.261 | 6.1% | 9.0% |
| 5 | 9 | 2002 | 0.257 | 12.2% | 21.2% |
| 6 | 8 | 3003 | 0.254 | 18.3% | 39.5% |
| 7 | 7 | 3432 | 0.250 | 20.9% | 60.5% |
| 8 | 6 | 3003 | 0.246 | 18.3% | 78.8% |
| 9 | 5 | 2002 | 0.243 | 12.2% | 91.0% |
| 10 | 4 | 1001 | 0.239 | 6.1% | 97.1% |
| 11 | 3 | 364 | 0.236 | 2.2% | 99.4% |
| 12 | 2 | 91 | 0.232 | 0.6% | 99.9% |
| 13 | 1 | 14 | 0.229 | 0.1% | 100.0% |
| 14 | 0 | 1 | 0.225 | 0.0% | 100.0% |
Scenario 2.
Scenario 1 was really too friendly to a batting average naysayer. In reality, we should do our probabilities with some potential that projection could be right as well.
- You select 14 players.
- They are each projected to hit .250 next season (just shy of the NFBC main event 20th percentile batting average).
- They have an even 33% probability of batting .225, .250, .275
The math in this scenario is a little more complicated, where you are really doing conditional combinatorics. Instead of 2^14 outcomes (~16000 outcomes) you now have 3^14 outcomes (~4.7M outcomes). Ultimately, the new scenario makes it even more unlikely for your team to reach an 80th percentile outcome. There is now just a 1.6% chance of finishing with a batting average at or above .262. In this scenario, there is now an 86% probability your team will finish within seven points of your projected batting average.
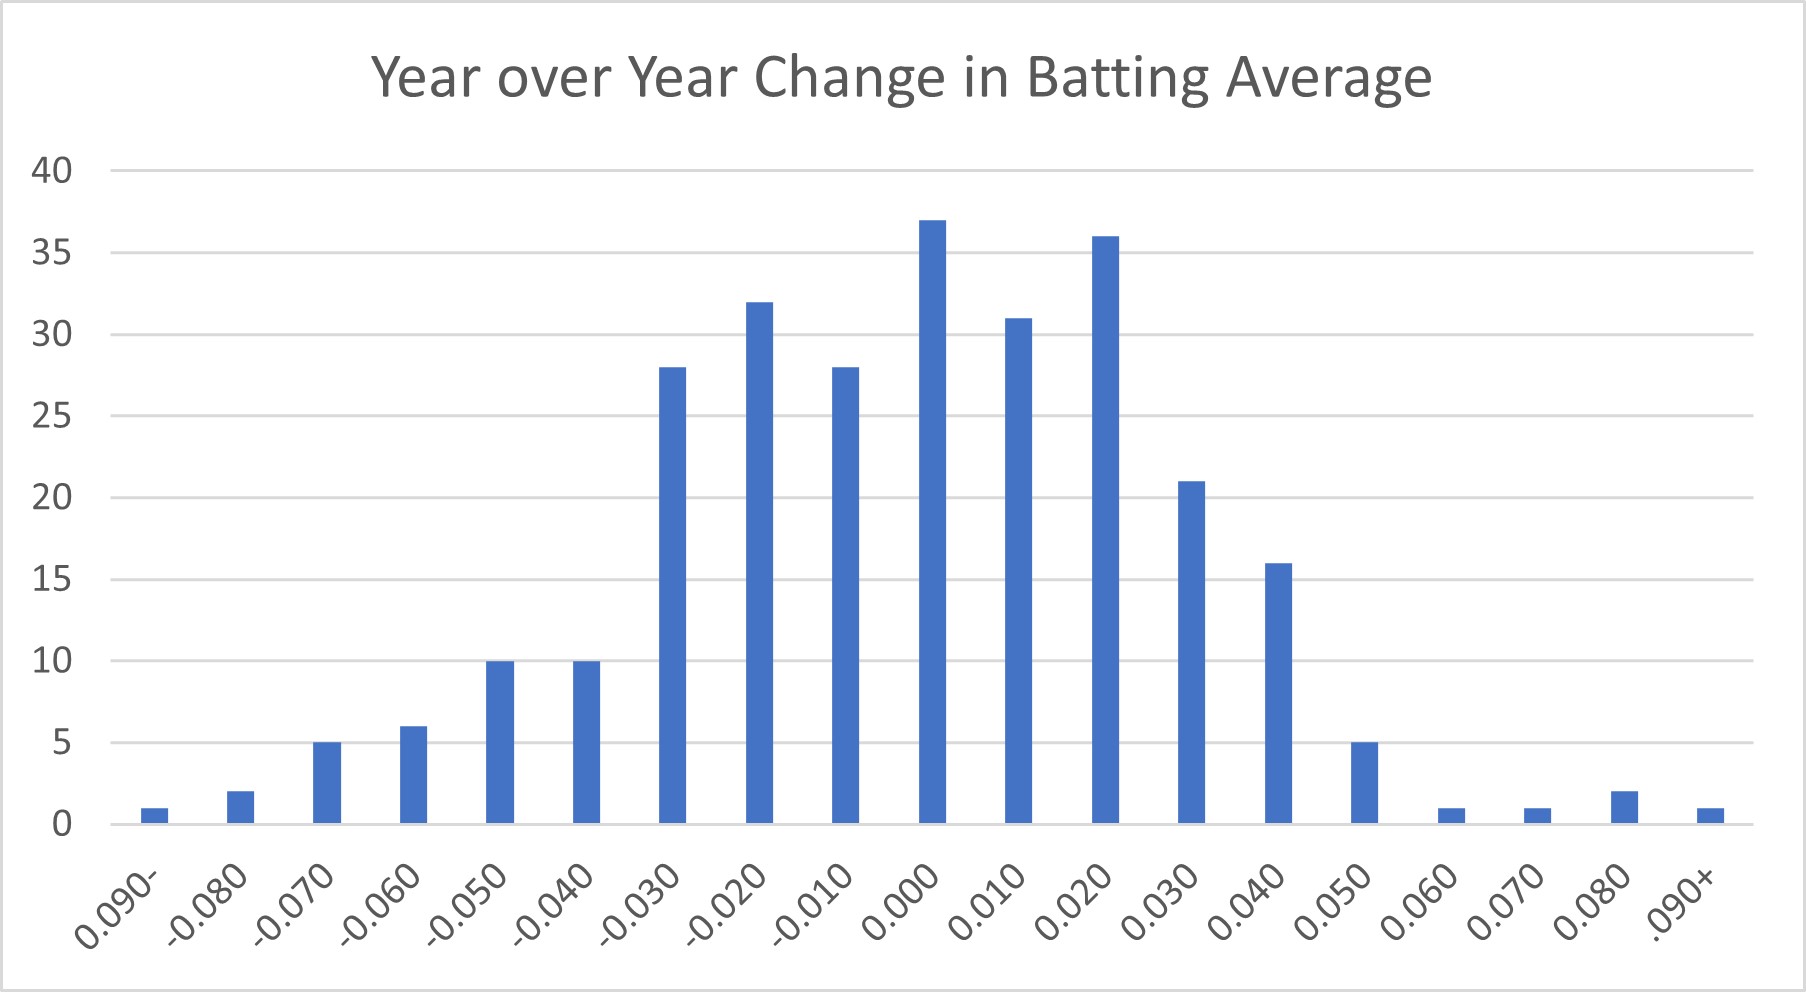
Finally, let’s examine just how variable batting average has been year-over-year. The chart below includes all players who had 400 PA in 2021 or 2022 and had 400 PAs in the following season (2022 or 2023). About 60% of the population fits into the middle 5 buckets, which accounting for rounding is +/- 25 points of batting average, similar to the range we used in our scenario. Given this distribution, the estimates in Scenario 2 are good guide for the variance (or lack thereof) you can expect in your team’s batting average in 2024.
Chart1: Year over Year Change in Batting Average (2021 > 2022 and 2022 > 2023)