
There has been a lot of digital ink spilled on the utility of Baseball Savant’s recently released bat tracking technology. Intuitively, there would seem to be a tight correlation between exit velocity and bat speed. To this end, could we identify batters whose actual exit velocities have been lagging what their bat speed would suggest?
My process:
- Look at all batters with 200+ swings to generate correlation between bat speed and exit velocity.
- Group hitters of this relationship into underperformers, overperformers, and neutral.
- See how these groups performed in May.
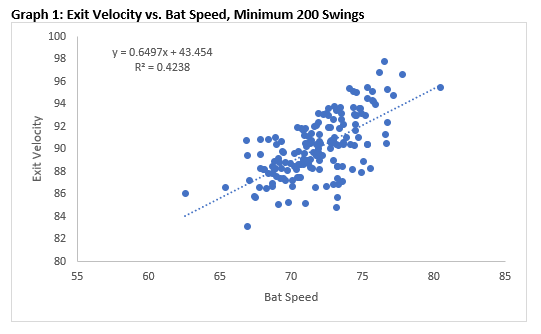
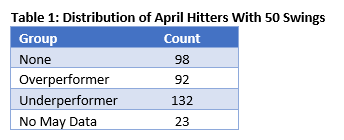
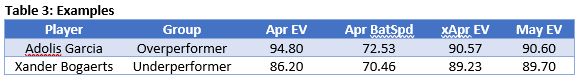
Our first view suggests, yes, there is a strong relationship between these two statistics. From here, I looked at April data used the above formula to calculated an “expected exit velocity” for each hitter based on their April bat speed. If a hitter overperformed his expected EV by over one mile-per-hour, I labelled them an “overperformer” while a hitter than underperformed his expected EV by one-mile-per-hour or more I labelled an “underperformer”. This yielded the following results:
Now that I had identified over/under performers from this data, I looked at how their actual may exit velocities compared to their April exit velocities. This data is shown in table 2 below.
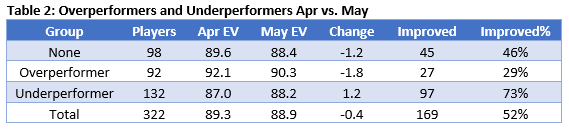
Table 2 presents a compelling case to use bat speed to identify players poised for exit velocity regression (positive and negative). April underperformers added 1.2 mph of bat speed month-to-month while overperformers lost -1.8 mph month-to-month.
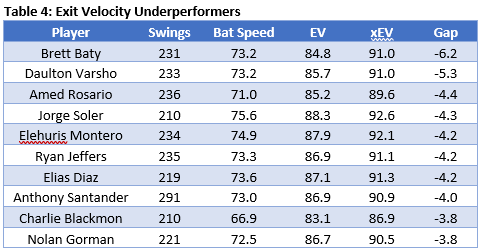
Another way to quantify the value of bat speed: April bat speed had an r-squared of 0.32 against May exit velocities, while April exit velocities had an r-squared of just 0.19. Can we use this data to identify some potential slow starters in batted ball statistics? Below is list of the top ten overperformers for the full season in my “xEV” stat.